

If you’ve landed here, you’re probably staring at a WooCommerce store that isn’t growing the way you want, and trying to figure out which numbers would actually explain why.
I’ve spent years building funnel and checkout tools for WooCommerce stores, which means I’ve spent most of that time inside actual store dashboards, not just reading about them from the outside.
One pattern shows up constantly, across stores selling everything from skincare to supplements to digital courses: sales stalls, and the first move is almost always more ad spend.
But if you’re doing anywhere from a few hundred to a few thousand orders a month, selling something in the $20–$150 range, the problem is rarely traffic.
It’s that revenue and order count are the only two numbers being watched, while the handful of numbers that would actually show where money is leaking out were never being collected in the first place.
This guide walks through exactly:
- Which funnel metrics matter for a store like yours
- Why does each one matter
- How to turn your checkout numbers into an actual dollar figure
There’s math further down showing how much revenue you can find in your own funnel before spending anything on a new visitor.
Quick Answer Marketing funnel metrics are the specific numbers — traffic, engagement, lead quality, conversion rate, average order value, cart and checkout abandonment, and customer lifetime value — that show how well your WooCommerce store moves someone from first visit to first purchase, and from first purchase to repeat customer.
Track them together, and you can see exactly which stage of your funnel is losing you money, instead of just buying more traffic and hoping.
TL;DR – Key Takeaways on Marketing Funnel Metrics
- You’re probably losing more revenue to checkout and cart drop-off than to low traffic. Check that before touching your ad budget.
- Conversion rate, average order value, and order bump acceptance rate together give you “effective revenue per 100 visitors”. A far more useful number than raw traffic.
- Funnel metrics (page-level, stage-level) aren’t the same as KPIs (business-level). Mixing the two up leads you to fix the wrong thing.
- Post-purchase metrics — retention rate and customer lifetime value — often move more revenue than acquisition ever will, for a fraction of the cost, and they’re the easiest ones to ignore.
- You don’t need a data team for any of this. If your store does a few hundred orders a month, you can track everything here with tools you probably already have.
What Marketing Funnel Metrics Actually Tell You
Marketing funnel metrics are the numbers that show how well each stage of your funnel is converting, not your revenue as a whole, but the individual handoffs that add up to it.
Let’s say you run a WooCommerce store selling skincare bundles, with an average order value of around $42. Someone finds your best-selling serum through a Google search, lands on the product page, and either buys or leaves.
Two numbers matter here, and neither one is “total sales”:
- Product page conversion rate — of everyone who lands here, how many add to cart?
- Checkout completion rate — of everyone who starts checkout, how many actually finish it?
If your traffic is healthy, but the conversion is low, the problem is upstream — pricing, product photos, trust signals, and page speed.
If people add to cart but drop off at checkout, the problem is downstream — a shipping cost that surprises them, a clunky form, or missing payment options.
Two completely different fixes, and knowing which one you actually have is what tells you where to spend your time and money next.
Why This Matters More If You Sell on WooCommerce
Your WooCommerce funnel works differently from a typical sales pipeline.
You’re usually asking someone to decide in a single session, your order values are modest, and a mistake at checkout costs you more, proportionally, than a slow-moving deal costs a B2B sales team.
A few things follow from that, and I’ve watched this play out enough times across enough stores to trust the pattern –
- Checkout friction hurts you harder, because you don’t have a sales rep to chase down a stalled deal.
- Order bumps and upsells matter more for you than for most funnels, since they’re the cheapest way to lift your AOV without touching your acquisition cost at all.
- And because you’re probably comfortable with WordPress but don’t want to touch PHP or wire up a custom tracking stack, the metrics you actually track need to come from tools that plug straight into WooCommerce, not a general analytics suite that needs a developer to configure.
That’s what decides which metrics deserve your attention first, which is what the rest of this guide walks through.
Funnel Metrics vs. KPIs: The Mix-Up That Costs You Money
A lot of people confuse marketing funnel metrics with KPIs, but they serve different purposes. It’s worth separating them because mixing them up is probably costing you time, money, and missed growth opportunities.
I’m breaking down the difference here because knowing which to focus on and when will keep your marketing efforts sharp and effective.
Here’s a quick table to break it down:
| Aspect | Marketing Funnel Metrics | KPIs |
|---|---|---|
| Purpose | Track a specific action inside the funnel | Measure overall business health |
| Focus | Product page views, cart adds, checkout starts | Revenue, profit margin, growth rate |
| Timeframe | Day-to-day, stage-by-stage | Monthly, quarterly, strategic |
| Example | Checkout abandonment rate, order bump acceptance | Customer lifetime value, net margin |
| What it tells you | Exactly where your funnel is leaking | Whether your business is winning overall |
Funnel metrics are diagnostic, KPIs are your scoreboard, and you need the diagnostic numbers to explain why your scoreboard moved.
If you’re only checking your KPIs, you’re watching the score without ever looking at the play that lost you the point, which means you won’t know how to fix it next time either.
The Metrics That Matter at Each Stage of Your Funnel
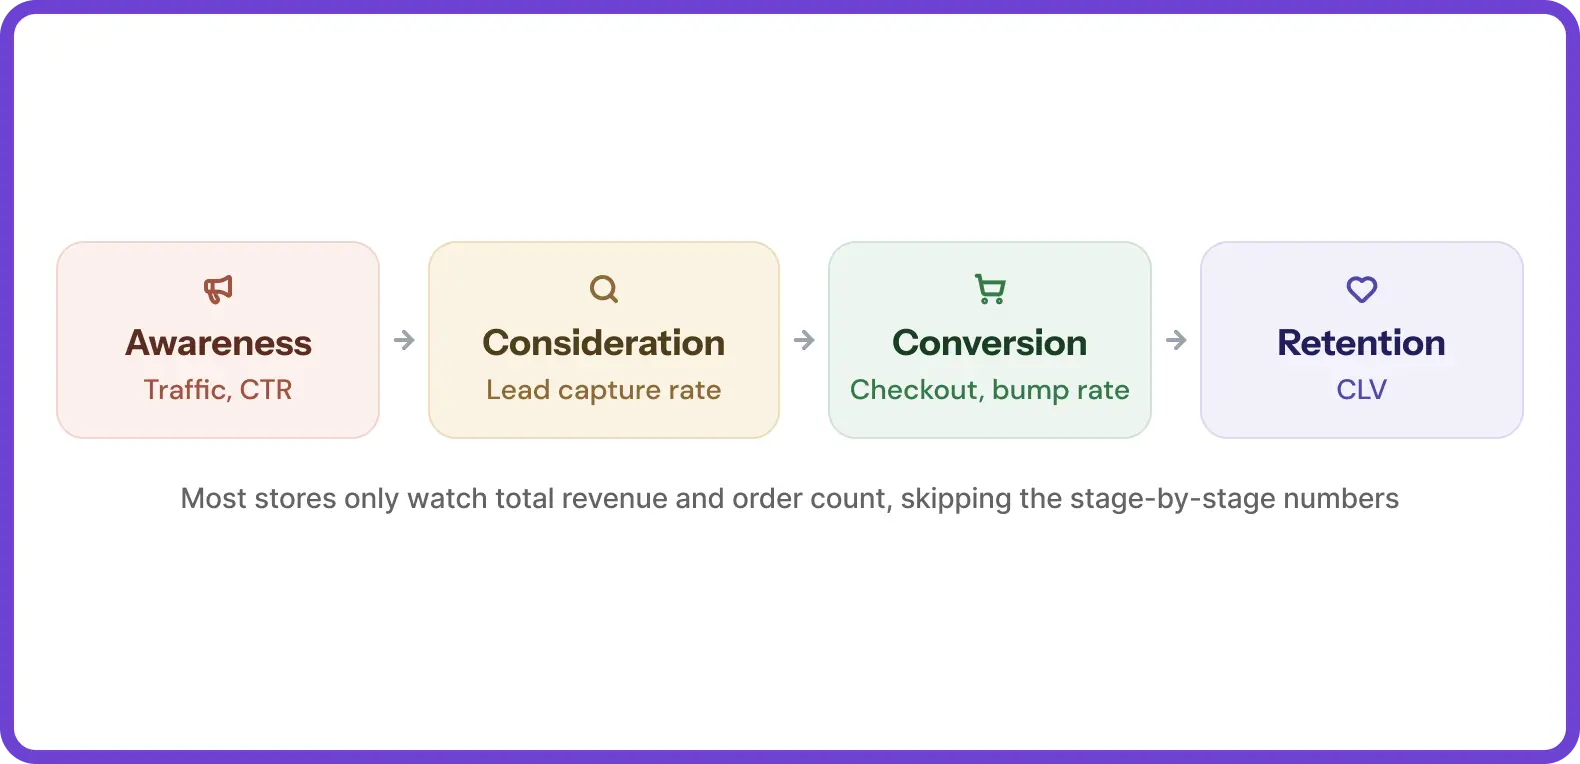
Top of Funnel (TOFU) — Awareness
At this stage, your only job is getting the right people to notice you exist. For your store, that’s usually a mix of organic search, social content, and paid ads pointed at product or category pages, not your homepage.
Watch these three:
- Traffic, split by organic, referral, and paid — each behaves differently
- Impressions and click-through rate from Google Search Console
- Bounce rate on landing pages
Good impressions with weak click-through means your meta title and description aren’t earning the click. People arriving and leaving right away usually mean that what you promised in the ad doesn’t match what you delivered on the page. Think of a Facebook ad for “30% off skincare bundles” that sends someone to your generic homepage instead of the actual bundle.
Tip: Time on page is worth a quick check too, mostly as a sanity test. If people are gone within a few seconds on a page meant to build trust before a purchase, that’s worth investigating with a heatmap tool before you spend more traffic sending there.
If you want a deeper breakdown of where your traffic is actually coming from and how to get more of the right kind, we’ve got a full guide on that here: How to Get More Targeted Traffic to Your Website.
Middle of Funnel (MOFU) — Consideration
This is where someone already knows you exist and is deciding whether to trust you enough to buy, or to hand over an email address for a discount code first.
For your store, this usually runs through an exit-intent pop-up, an abandoned cart email, or a lead magnet like a buying guide.
Track your:
- Lead generation rate — what percentage of visitors give you an email
- Lead quality — do those leads open your emails, does your bounce rate stay low
- Lead engagement rate — does what you’re sending match what got them to opt in
Gut-check: If your discount pop-up converts well but your welcome sequence has low open rates, the mismatch is usually between the offer and the follow-up — someone opted in for 15% off and got a generic newsletter instead of a clear path to actually redeem it.
If lead magnets aren’t really your strong suit yet, we put together a list of ideas that actually convert here: Lead Magnet Ideas.
Bottom of Funnel (BOFU) — Conversion
This is the stage where people actually hand you their money. Conversion rate and customer acquisition cost matter most here.
But there’s a third number I see almost nobody isolates on its own, even in stores that are otherwise careful about tracking — order bump and upsell acceptance rate. It’s the one that changes your entire funnel math. You’ll see exactly why in the math section further down.
If order bumps and upsells are new territory for you, we’ve got a full breakdown of the different types and when to use each one here: Types of Upsell.
Post-Purchase — Retention & Loyalty
Once someone buys from you, the funnel doesn’t end, it loops.
Two numbers matter most here:
- Customer retention rate — the percentage of customers who buy again within a given period
- Customer lifetime value — total revenue from a customer across every purchase, not just their first
Since keeping a customer you already have is consistently cheaper than getting a new one.
If you sell consumables, skincare, supplements, or coffee, you have a natural repeat-purchase cycle built in. Track your retention rate, and you’ll catch a dip in that cycle within a month. Only watch total revenue, and you won’t notice until the quarter’s already gone.
Retention is a big enough topic that it deserves its own guide, so if you want the full playbook, here it is: How to Improve Customer Retention.
The Math You’re Not Running (But Should Be)
Let’s put real numbers behind this instead of talking about it in the abstract.
Say your WooCommerce checkout converts at 2.5% out of every 100 visitors who reach your checkout, 2.5 complete a purchase.
That’s close to the broader benchmark: average landing page conversion sits around 2.35%, with top-quartile pages hitting 5.31% or higher, per WordStream benchmark data cited in a 2026 landing page conversion analysis.
Your average order value is $50.
Now add a number, you’re probably not isolating on its own: your order bump acceptance rate — the percentage of buyers who say yes to that one extra item offered right before or during checkout. Say it’s sitting at 20%, and the bump adds $12 to the order.
Run the math on your own 100 visitors:
- 2.5 buyers at $50 = $125 in base revenue
- 20% of those 2.5 buyers take the bump: 0.5 buyers × $12 = $6 in bump revenue
- Your effective revenue per 100 visitors: $131
Here’s where it gets useful. Say you don’t touch traffic at all. No extra ad spend. Instead, you improve your bump offer a more relevant product, better placement, clearer copy — and acceptance climbs from 20% to 35%, which is a realistic jump for a bump that wasn’t optimized to begin with:
- 2.5 buyers at $50 = $125 in base revenue
- 35% of 2.5 buyers take the bump: 0.875 buyers × $12 = $10.50 in bump revenue
- Your effective revenue per 100 visitors: $135.50
That’s a 3.4% lift from the same 100 visitors, without you spending a cent on acquisition.
Now stack a checkout conversion improvement on top of it, say conversion climbs from 2.5% to 3% because you shortened the form and added guest checkout, and those same 100 visitors are now worth roughly $158 to you.
That’s over 20% more revenue, and you still haven’t bought a single new visitor.
This is the number worth calculating before you raise your ad spend: effective revenue per 100 visitors, factoring in your checkout conversion, AOV, and bump acceptance together. Almost nobody tracks it as one figure. It’s usually the fastest way to find money that’s already sitting in your funnel.
Which Metric Should You Check First?
Once you’re tracking these, the obvious next question is where to actually look. Use a rough triage based on what you’re seeing, and it’ll point you at the right metric faster than starting from scratch.
Use a rough triage based on what you’re seeing:
- Traffic looks fine, but your sales feel flat → It’s your conversion rate or checkout abandonment. More ads will make this worse.
- Your revenue per order feels low for your pricing → It’s an AOV problem. Order bumps and upsells cost nothing to test against the traffic you already have.
- Customers buy once, never come back → It’s retention and CLV. Win-back emails and reorder reminders are usually your cheapest fix of the three.
If that’s you, we’ve written a full walkthrough on setting up win-back automation here: Win Back Inactive Subscribers with Mail Mint.
Only once your checkout is converting well, your AOV is reasonable for your niche, and your retention is holding steady, does it actually make sense for you to spend more on top-of-funnel traffic? At that point, yes, more visitors are the lever that moves things for you.
How WPFunnels Analytics Tracks These Metrics Automatically
The math above is worth running by hand once, so you understand what it’s actually telling you.
But you don’t want to recalculate your effective revenue per 100 visitors every week by pulling numbers out of three different dashboards.
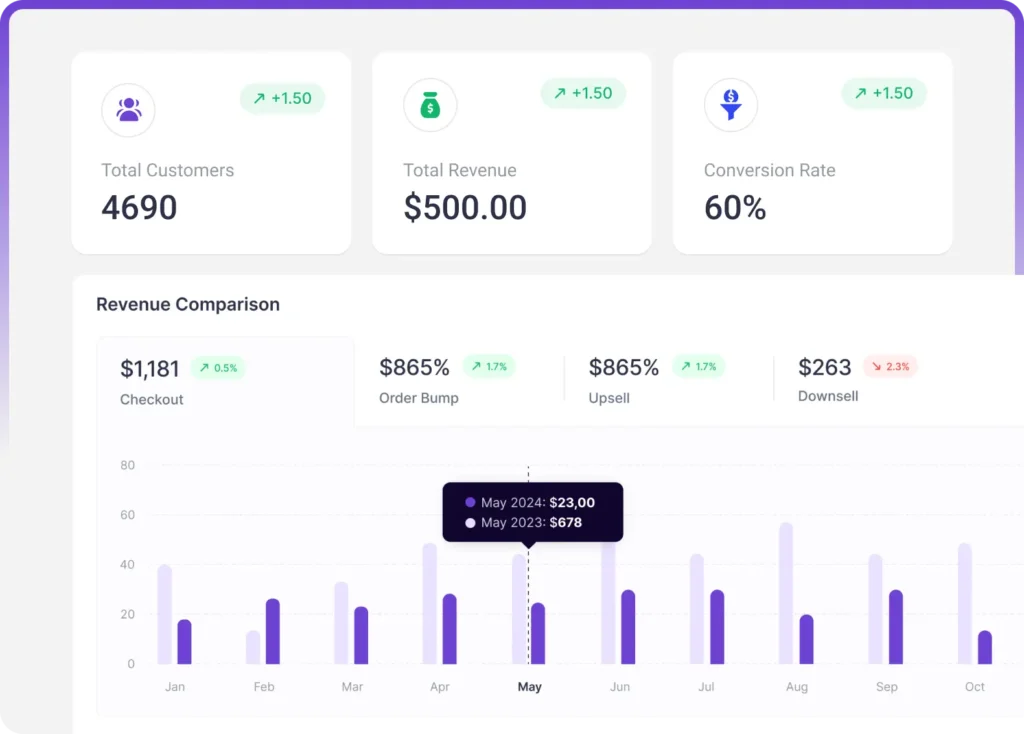
That’s the practical case for running your funnel through WPFunnels instead of stitching together Google Analytics, your payment gateway’s dashboard, and a spreadsheet yourself.
Funnel Analytics tracks, per funnel step:
- Page-level traffic
- Conversion rate
- Revenue
- Order bump and one-click upsell acceptance rate specifically
On the retention side, Mail Mint covers the post-purchase metrics from this guide for you.
Abandoned cart recovery catches your checkout drop-off automatically, and its automation workflows are what actually improve your retention rate, not just report on it after the fact.
The Rest of Your Tracking Stack
Beyond WPFunnels and Mail Mint, there are a few more tools that can help you track everything covered in this guide.
- Google Analytics — gives you your overall traffic and session behavior
- Google Search Console — shows you your organic impressions and click-through rate, where you’ll catch a bad meta description before it costs you more traffic
- A heatmap tool, like Hotjar — worth using sparingly, mainly when your bounce rate or time-on-page numbers look off, and you need to see exactly where people stop reading or scrolling on your pages
- Split testing — tells you which version of a headline, bump, or checkout layout actually moves the metric you’re fixing
You don’t need all of this running at once from day one. Start with whatever your framework above pointed you toward, track that properly for a month, then expand from there.
What I’d Do If This Were My Store
If I were looking at your numbers today, I wouldn’t start by asking how to get you more traffic.
I’d ask to see your checkout conversion rate, your order bump acceptance rate, and your retention rate first, because those three usually explain more about a stalled store than a traffic problem does.
So here’s the order I’d actually check things in, and I’d encourage you to do the same this week: look at your checkout and cart abandonment first, since that’s usually your most expensive leak.
Calculate your effective revenue per 100 visitors next, so you know whether an AOV fix is worth your time. Only once both of those look healthy, look at scaling your traffic.
Do it in that order, and what looks like a traffic problem for you usually turns out to be a measurement gap instead.
If checkout and cart abandonment is where you’re starting, we’ve rounded up the best recovery plugins for WooCommerce here: Best WooCommerce Cart Abandonment Recovery Plugins.
Frequently Asked Questions
What’s the difference between a marketing funnel metric and a KPI for my WooCommerce store?
A funnel metric measures one specific handoff, like your checkout abandonment rate. A KPI measures your overall business health, like monthly revenue growth. You need the funnel metrics to actually explain why your KPI moved.
How do I calculate effective revenue per 100 visitors for my own store?
Multiply your checkout conversion rate by your average order value to get your base revenue per 100 visitors, then add your order bump or upsell acceptance rate multiplied by the bump’s average value. Track this monthly, and you’ll quickly see whether an AOV fix or a traffic fix is worth your time.
Is more traffic ever actually the right fix for me?
Yes. Once your checkout is converting at a healthy rate for your niche, your AOV reflects a reasonable bump and upsell uptake, and your retention rate is stable, more traffic becomes your remaining lever. The mistake is reaching for it before you’ve checked the other three.
What order bump acceptance rate should I be aiming for?
There’s no universal target since it depends on your bump’s relevance and price relative to the main product, but a bump priced under roughly 25% of the original order, and directly complementary to it rather than just “add anything,” tends to do noticeably better for most stores.
How often should I actually check these numbers?
Your traffic and conversion rate are worth a weekly glance since they shift quickly with any campaign change you make. Your AOV and bump acceptance are worth checking every two weeks. Your retention rate and customer lifetime value move slowly, so monthly is enough for you, checking those weekly just adds noise.
Do I need a developer to set any of this up on my WooCommerce store?
No. Everything here is trackable through WooCommerce-native tools you can set up yourself — Google Search Console, Google Analytics, and a funnel builder like WPFunnels that reports on your order bump and upsell performance without touching a line of code.

Comments are closed.






Comments (2)
The distinction between funnel‑metrics and KPIs — helps clarify what to focus on day‑to‑day vs long‑term.
WPFunnels
Good mix of awareness metrics (traffic, engagement) and deeper ones like lead quality and customer lifetime value.
WPFunnels
Practical suggestions for tools you can use (Google Analytics, Ahrefs, CrazyEgg, etc.) to monitor behavior and optimize steps.
WPFunnels
Thanks for this — it’s a solid roadmap for anyone looking to build or improve their marketing funnel with data, not guesswork.
Thanks for the clear breakdown of funnel metrics — it’s helpful to see the stage-by-stage approach (awareness → conversion → retention) laid out so practically. I appreciate the emphasis on tracking the right numbers, not just traffic.