
Mail Mint’s Abandoned Cart feature includes a built-in Carts Analytics dashboard that gives you a clear picture of how many carts are being abandoned, how many you’re recovering, and how much revenue your recovery emails are generating.
Prerequisites
- Enable Cart Tracking turned on under Mail Mint → Settings → Abandoned Cart
- At least a few tracked carts — the dashboard will show zero values otherwise
Where to Find It
Go to Mail Mint → Abandoned Cart. Once carts have started being tracked, open Carts Analytics — use the Back link at any time to return to the Carts list.
Stat Cards
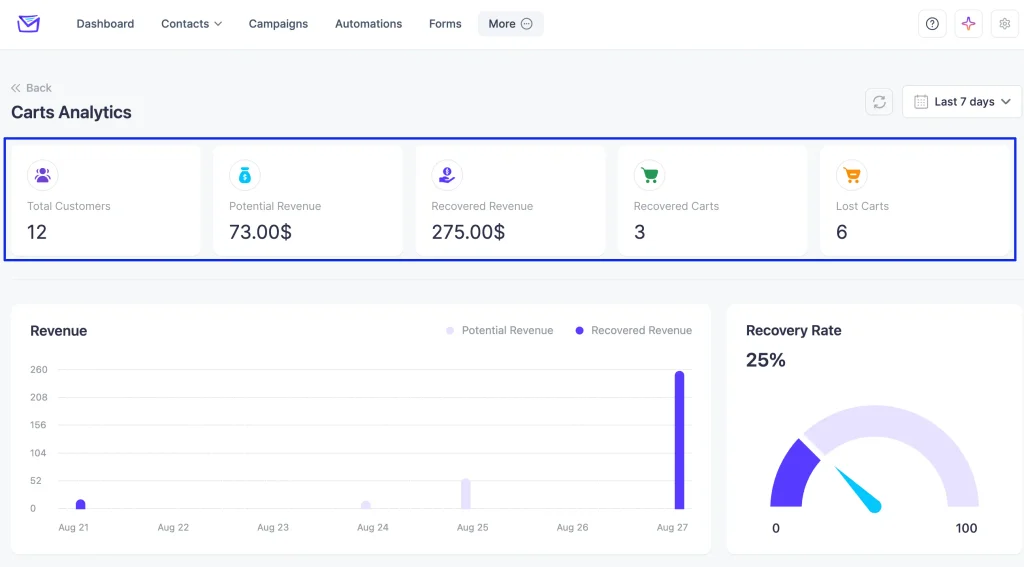
Five cards across the top of the dashboard:
| Metric | What It Means |
|---|---|
| Total Customers | Unique shoppers with a tracked cart in the selected date range. |
| Potential Revenue | Total dollar value of carts in the range that are still recoverable — not yet recovered or lost. |
| Recovered Revenue | Total dollar value of carts that converted into completed orders after abandonment. |
| Recovered Carts | Count of carts that converted to an order (i.e., reached one of the order statuses configured under Mark Cart as Recovered). |
| Lost Carts | Count of carts that passed the Mark as Lost after (days) window without converting. |
Revenue Chart & Recovery Rate
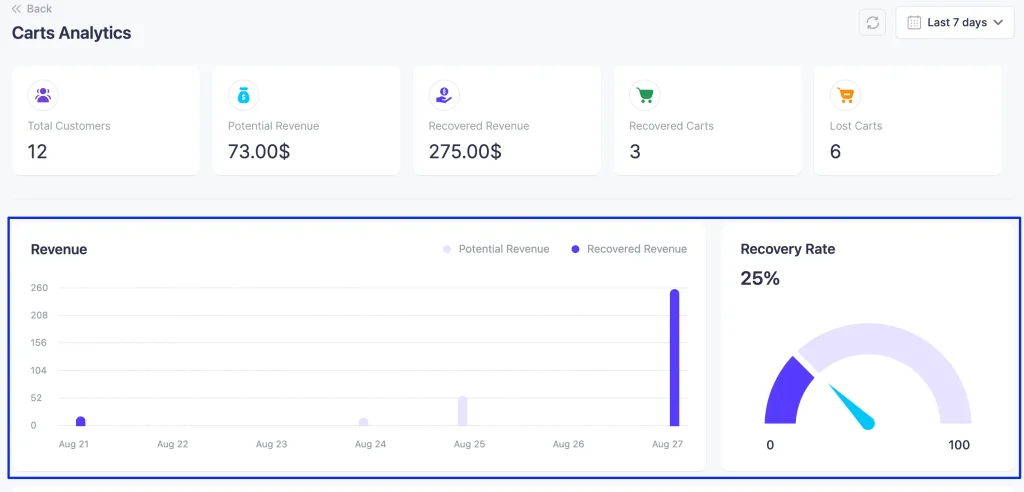
Below the stat cards is a Revenue bar chart plotting Potential Revenue vs. Recovered Revenue per day across the selected range.
Next to it, a Recovery Rate gauge (scaled 0–100) shows what percentage of tracked carts in the range were successfully recovered.
Cart Status Trend Chart
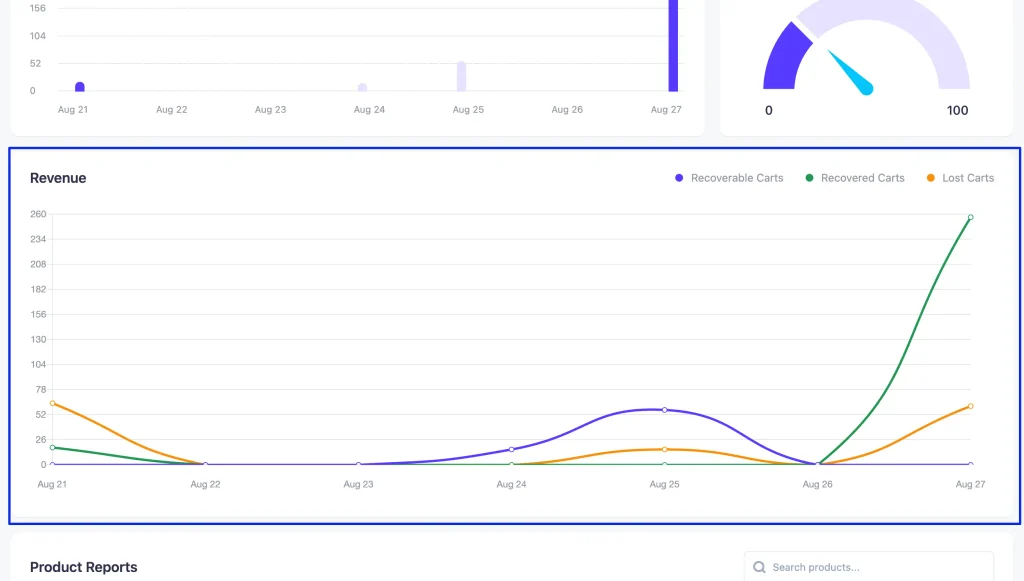
A second, larger Revenue chart breaks the same date range down by cart status as three line series:
- Recoverable Carts
- Recovered Carts
- Lost Carts
This is the most useful view for spotting trends — for example, a Recovered Carts line climbing late in the week while Lost Carts stays flat is a sign your recovery emails are converting; a rising Lost Carts line with flat Recovered Carts may point to a deliverability or timing issue.
Product Reports
Below the charts, the Product Reports table breaks abandonment down by product, with a search box to filter by product name.
| Column | Description |
|---|---|
| Product Name | Product thumbnail, name, and ID. |
| Times Abandoned | Count of carts containing this product that were abandoned, plus the total dollar value abandoned. |
| Times Recovered | Count of those carts that were recovered, plus the total dollar value recovered. |
Use this to spot high-abandonment products (candidates for clearer descriptions, pricing adjustments, or a targeted recovery offer) versus products that recover well on their own.
Tips & Best Practices
- Check Carts Analytics regularly — a sudden rise in Lost Carts can signal a recovery email deliverability issue worth investigating.
- Compare date ranges — use the custom range to measure the impact of a Timing Configuration or email template change before and after you made it.
- Cross-reference Product Reports with your Timing Configuration — a product with a high abandon count but low recovery may benefit from a shorter Wait Period so the first reminder lands sooner.
- Watch Recovery Rate over time, not just in isolation — a single week’s number can be noisy with a small sample of carts.
